Vault FiCharting Platform for professional traders.
Built for traders who want a more structured read of the market, Vault Fi combines institutional chart context, live trade guidance, AI-assisted analysis, machine learning projection, and advanced visual overlays into one premium charting workspace. This is where charting, scenario planning, and market structure interpretation come together in a single operating environment.
Institutional levels
AI trade analysis
Machine learning projection
Advanced live overlays
What it is
Professional charting
A trader-focused charting workspace for studying live structure, reaction zones, and scenario quality.
What it helps with
Faster reads
It reduces visual noise and helps traders focus on higher-value structure and clearer decision areas.
Core edge
Institutional framing
Built around how pressure, reaction, reclaim, rejection, and continuation appear on the chart.
Designed for
Serious traders
Useful for active chart users across metals, forex, crypto, indices, stocks, and broader multi-asset analysis.
Platform overview
A platform page built from the full guide, not a generic landing screen
Below, the page presents the core platform pillars using the actual feature visual language you supplied. The design keeps the sign-in experience at the top, then opens into a structured institutional-style overview of the charting platform so visitors immediately understand what the product is, how it reads markets, and why the workflow is different from ordinary chart tools.
Institutional structure
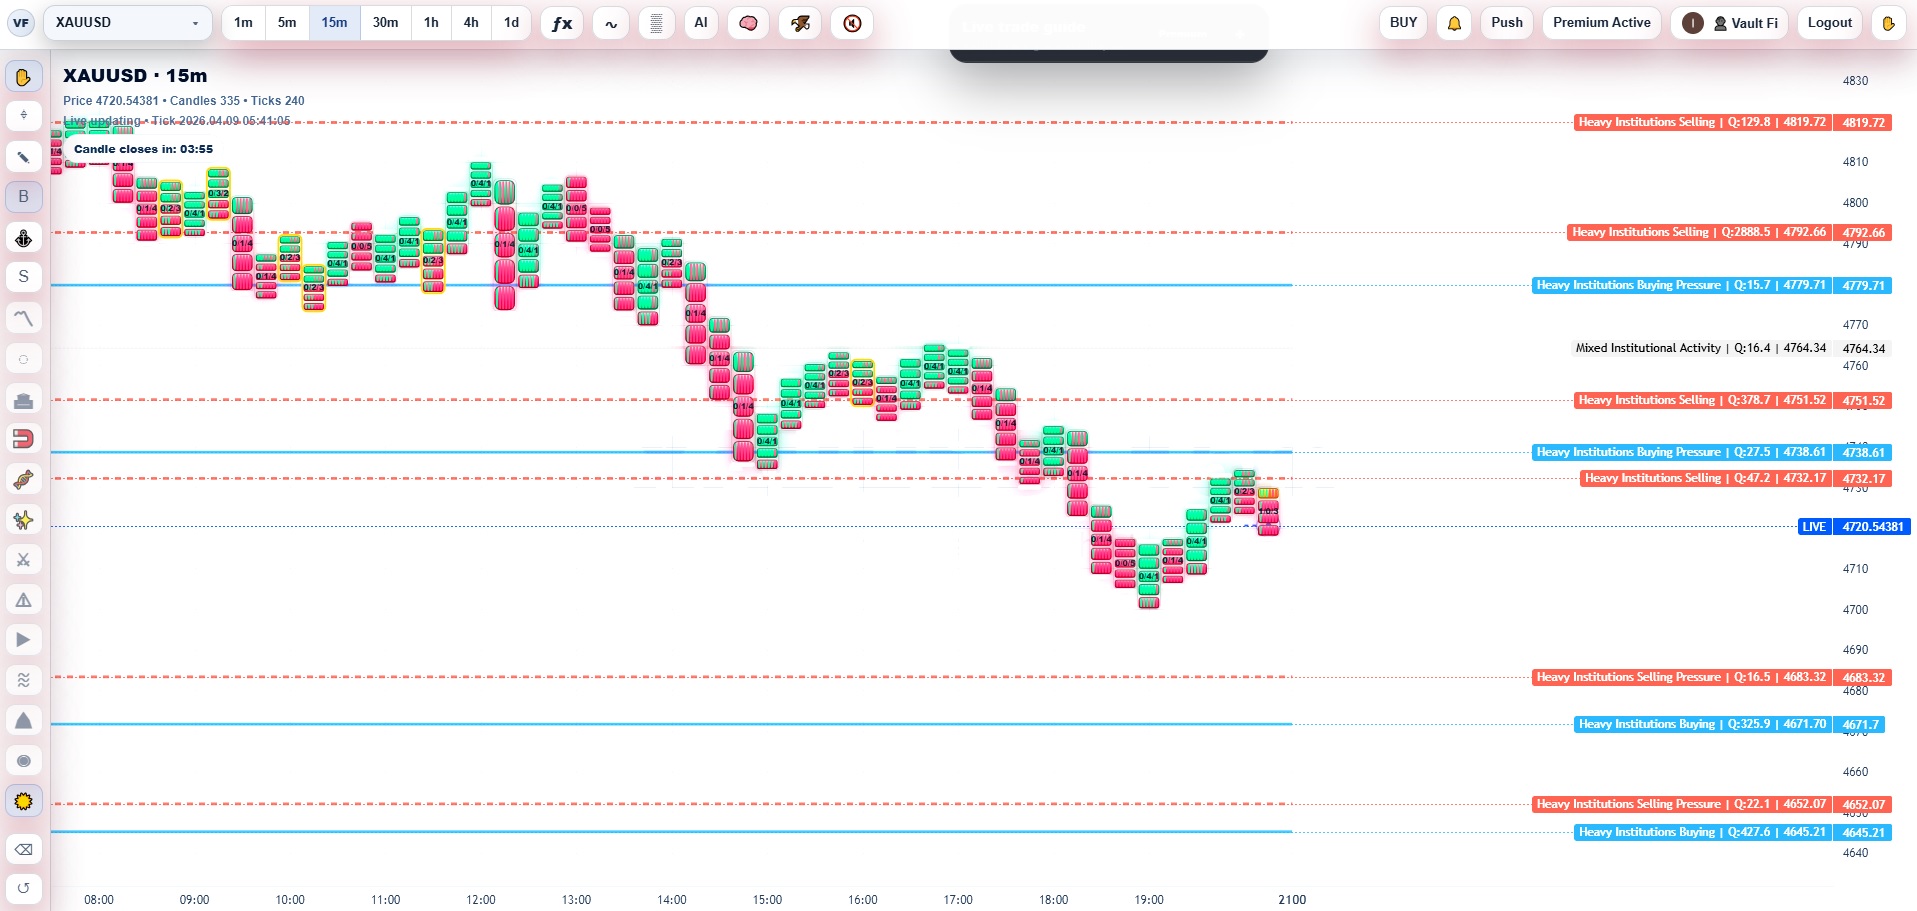
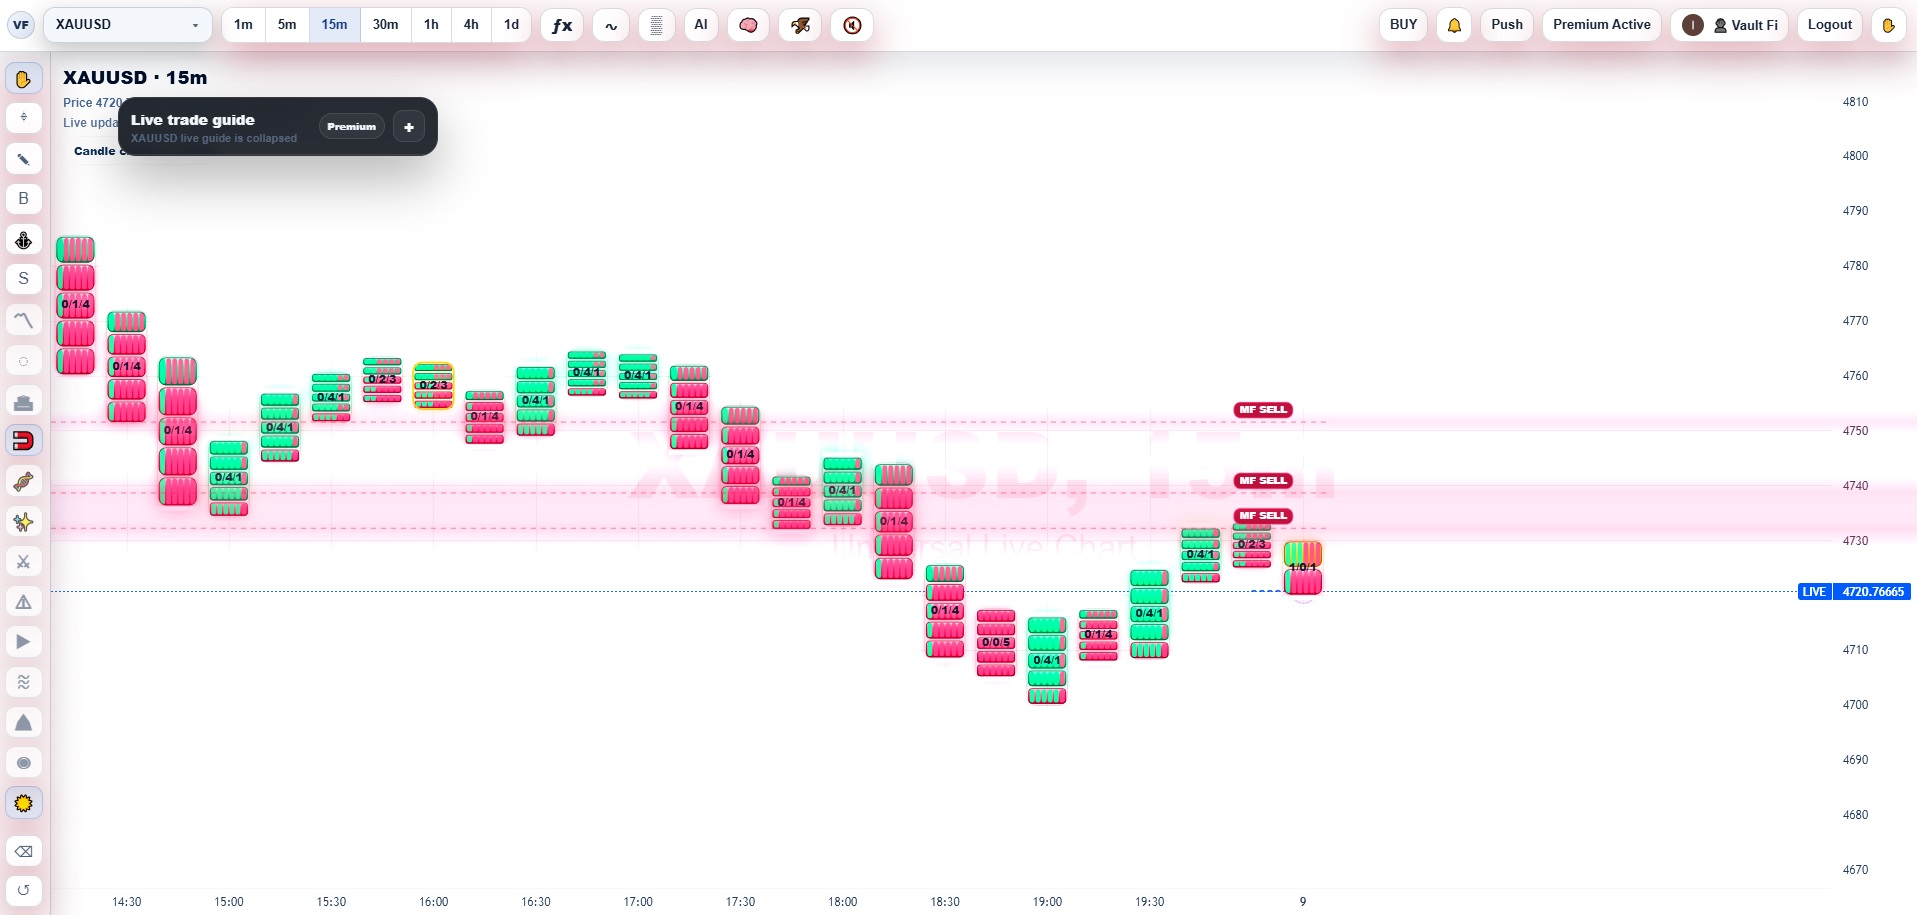
Institutional Buy & Sell Levels
Read the market through mapped buying pressure and selling pressure zones designed to keep focus on where larger participants are most likely to react. Instead of trading random movement, traders can frame decisions around clearer high-interest areas on the chart.
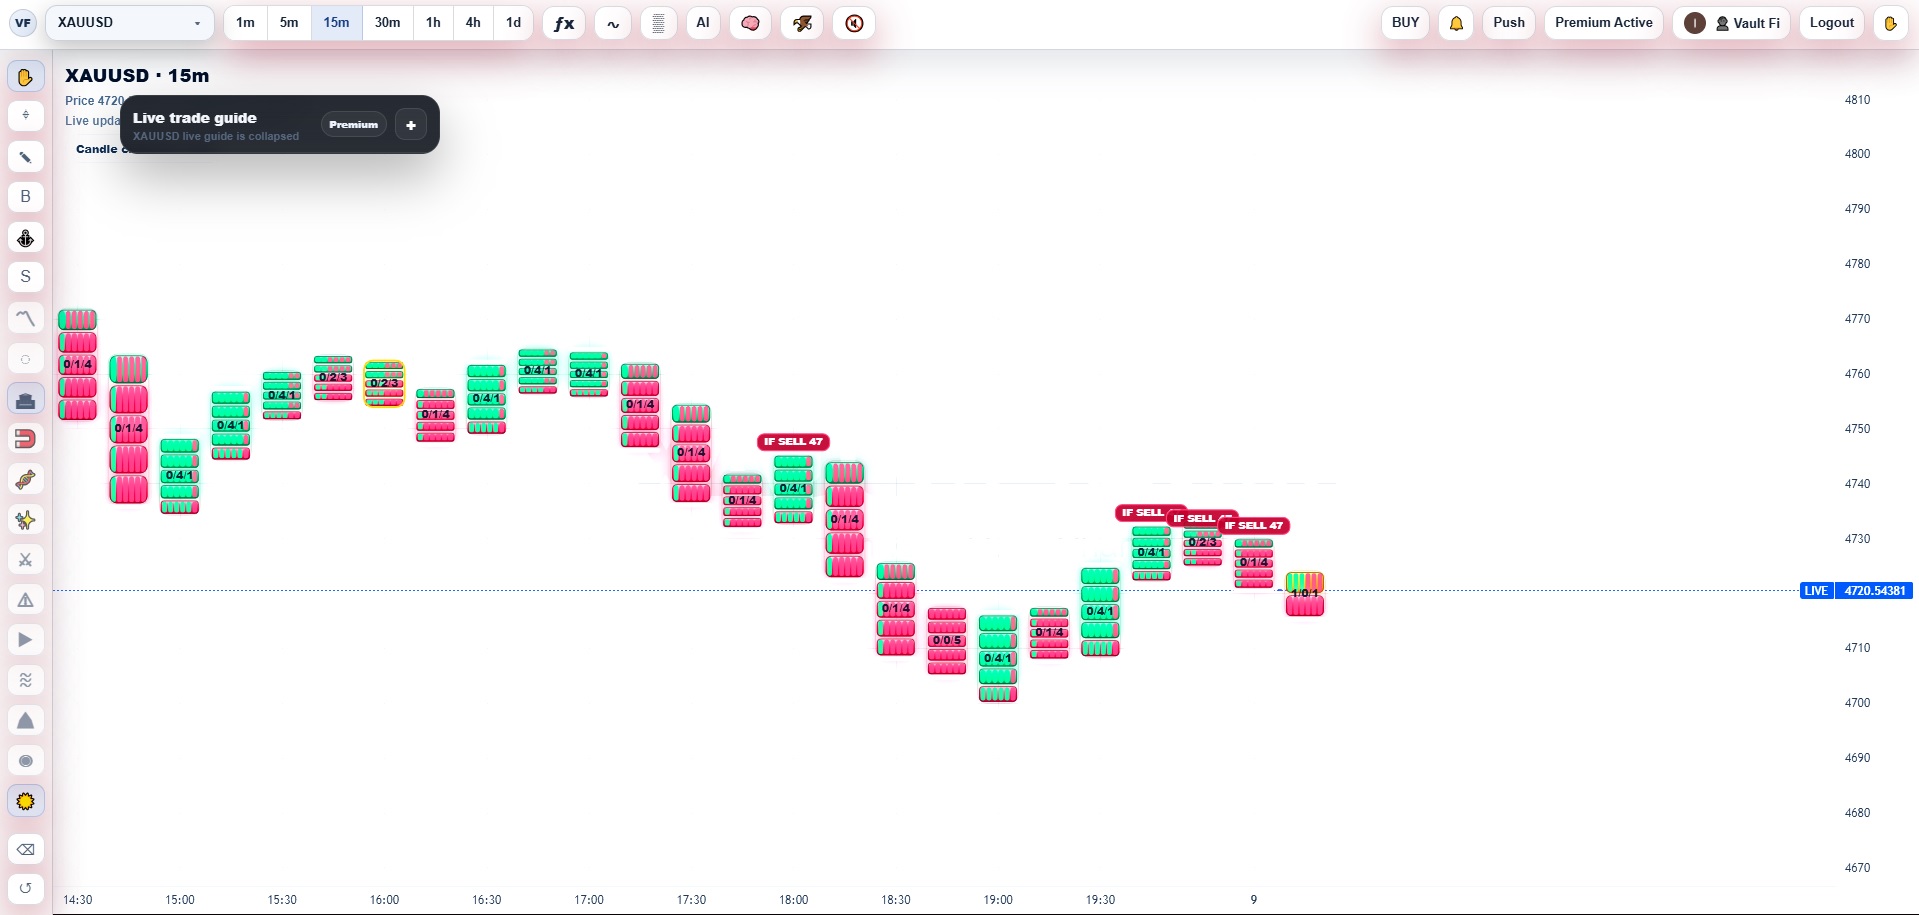
Decision support
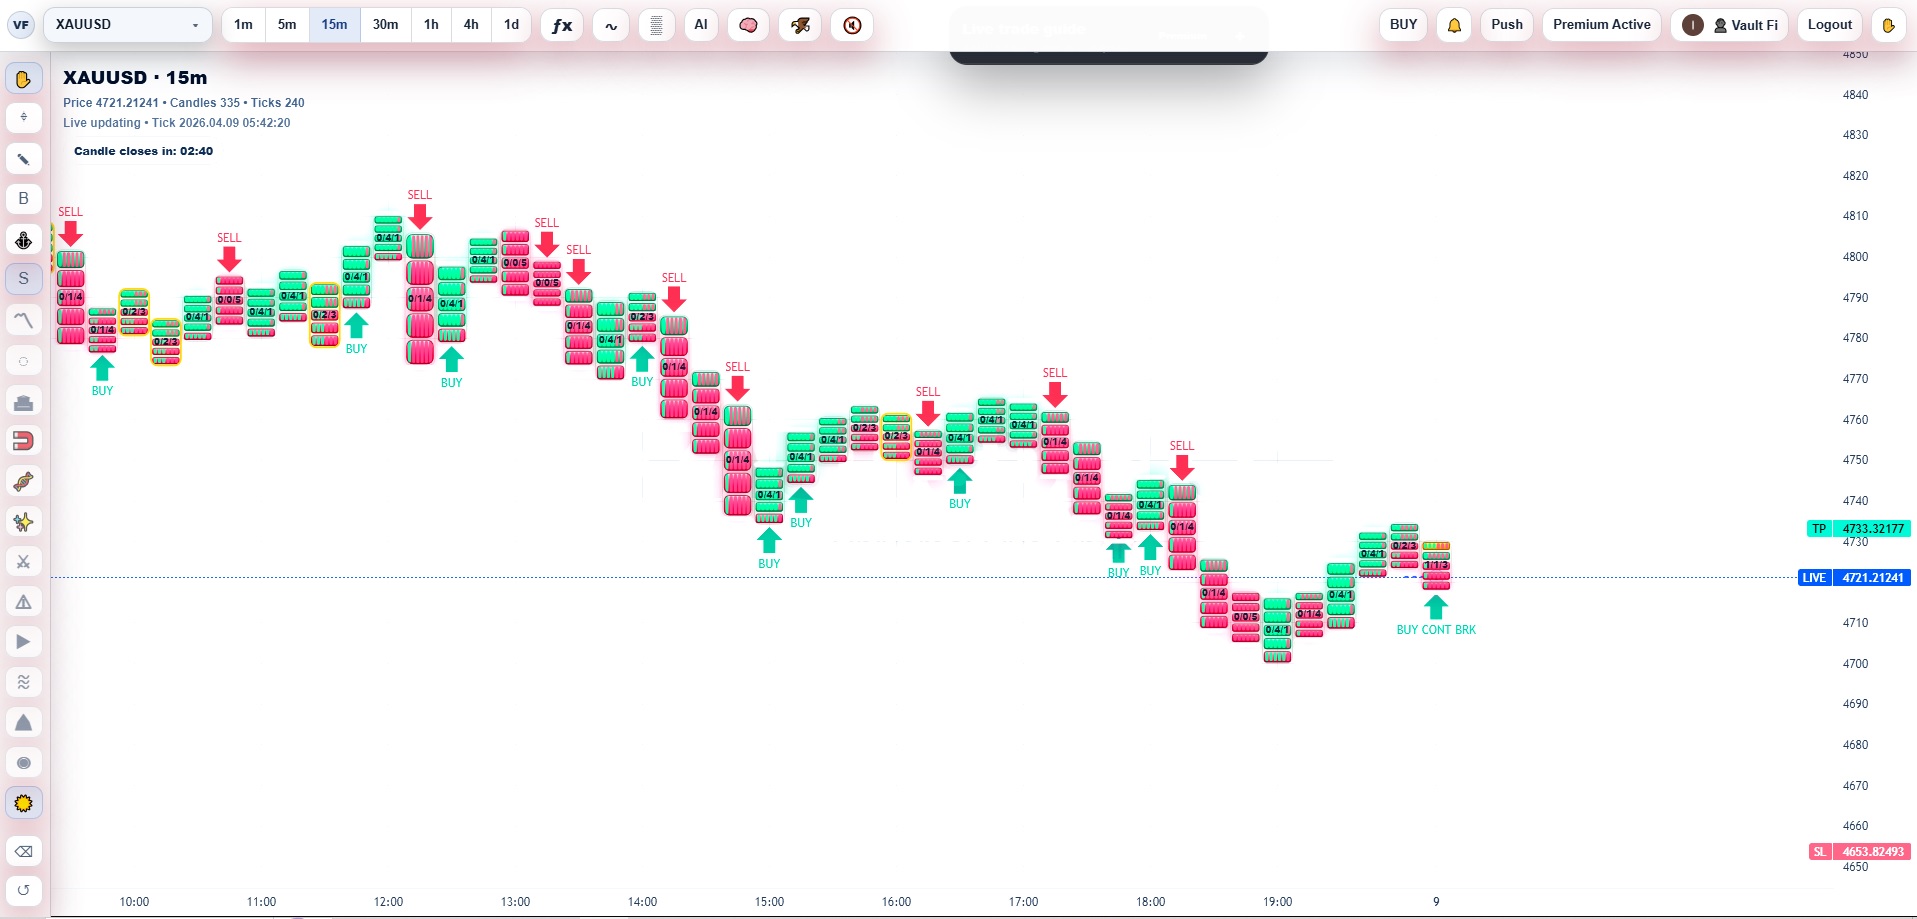
On-screen Buy / Sell Signals
See live chart-side directional cues with projected target and invalidation context. This helps traders move from analysis to action faster while staying anchored to visible, structured signals instead of emotion.
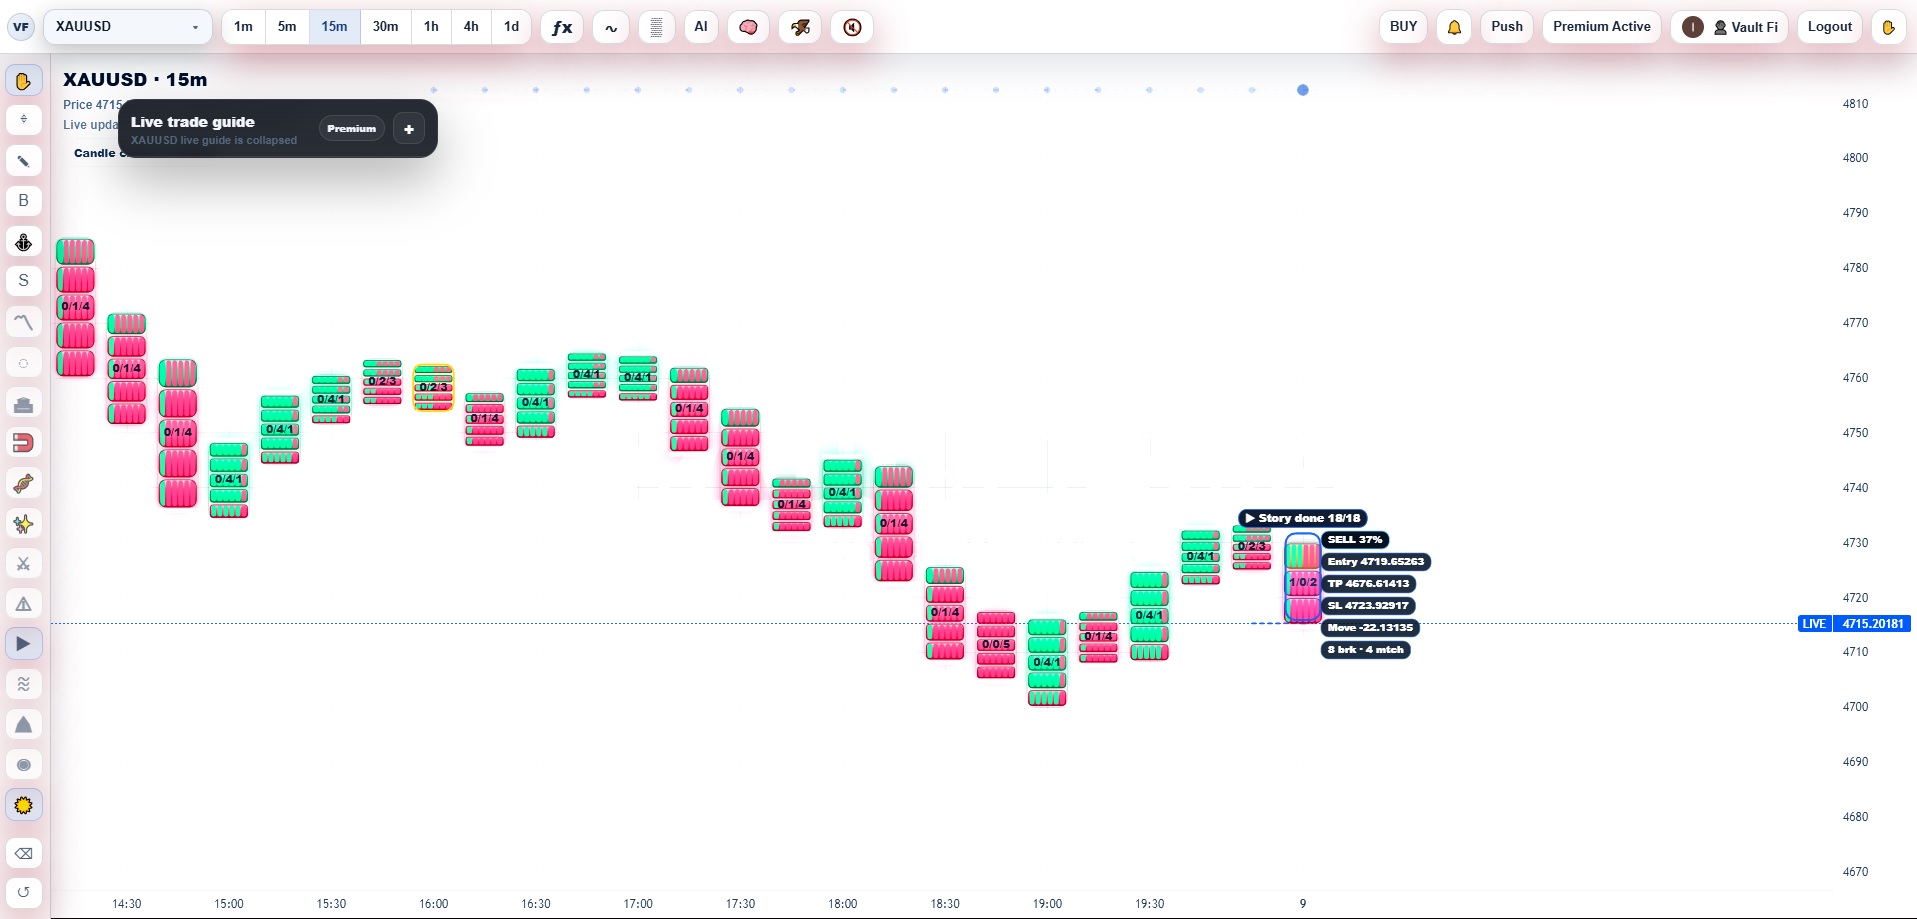
Guided workflow
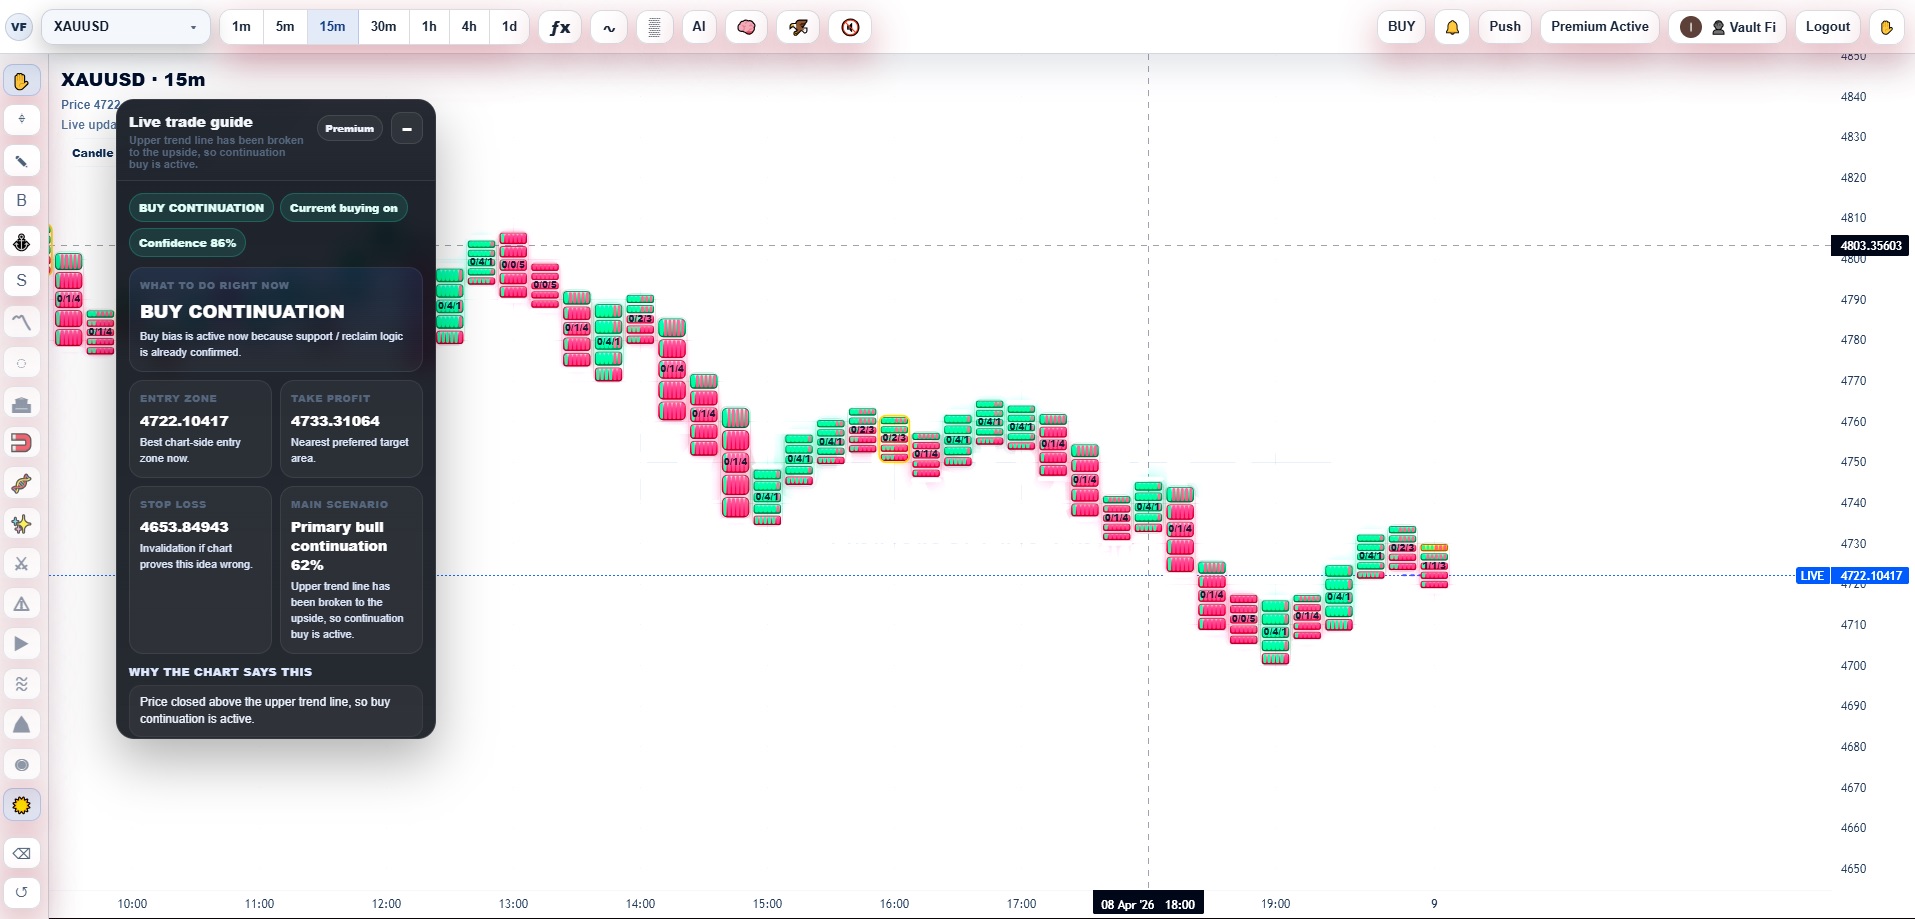
Live Trade Guide
The Live Trade Guide turns the active chart into an operating desk. It keeps the current scenario, likely continuation or rejection path, and the most actionable trade framing visible while price evolves.
AI trade analysis
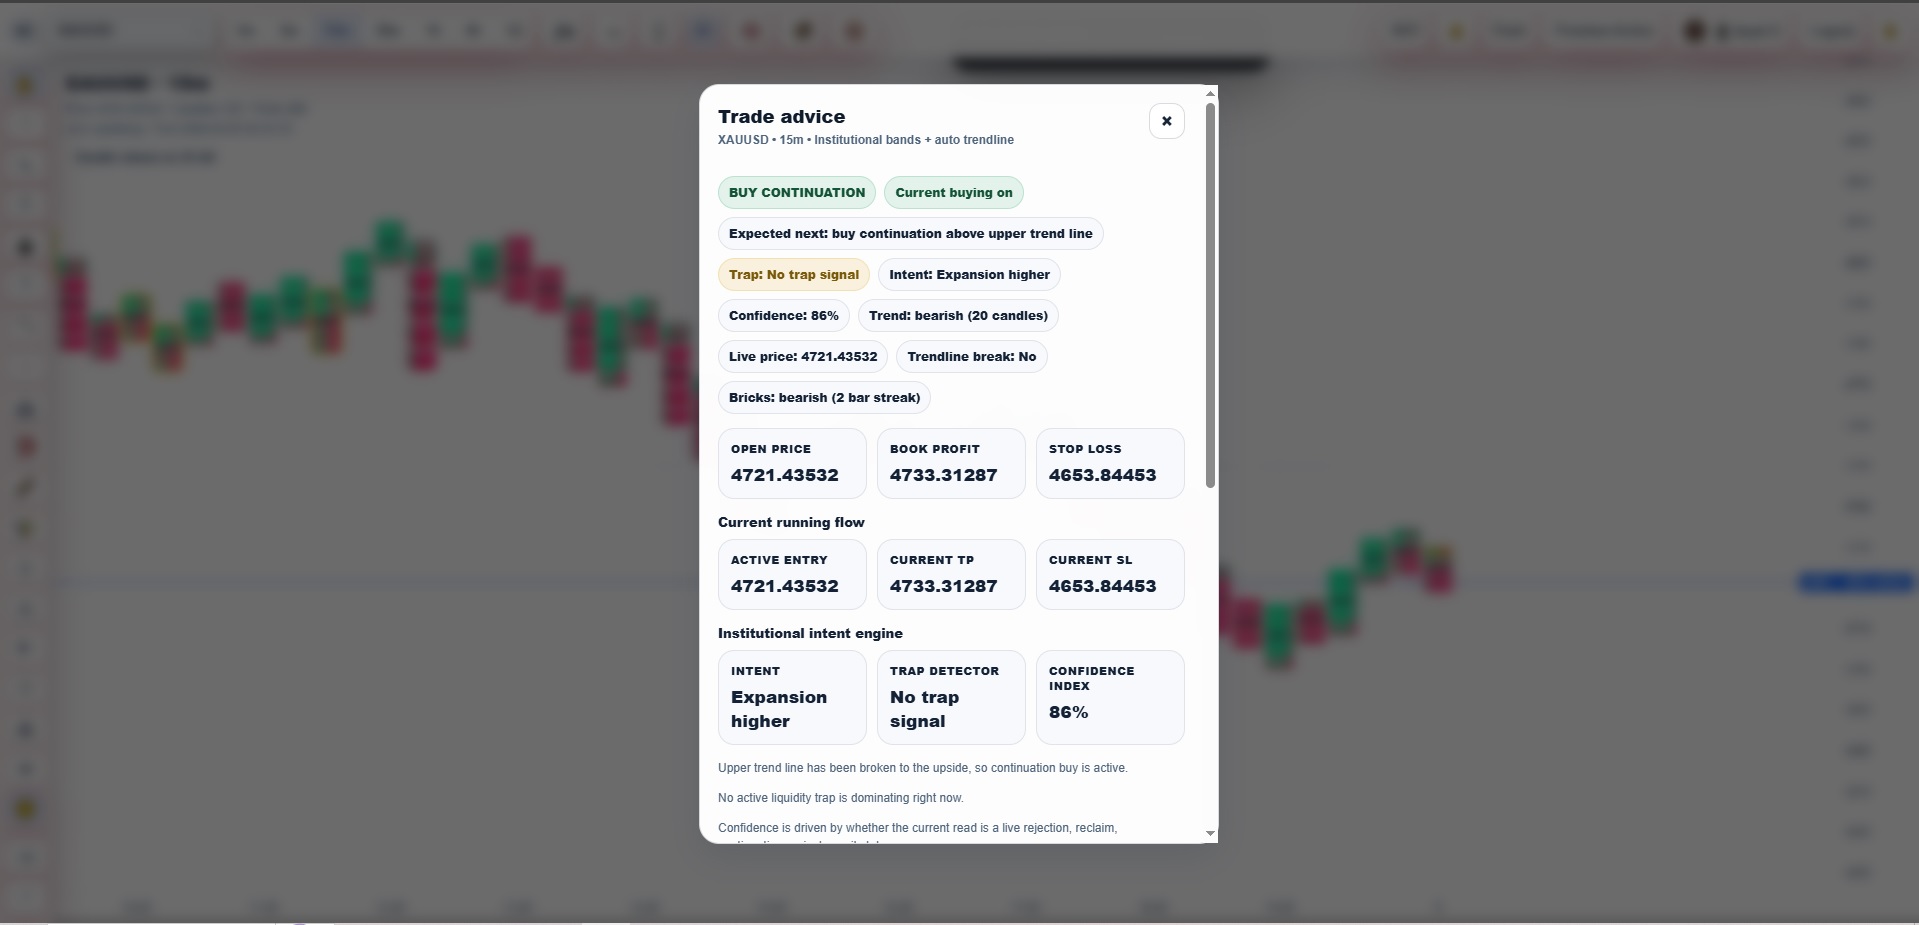
Trade AI Model
Analyze open trade context through an AI reading of active structure, bias, scenario direction, and tactical alignment. This is built to help traders evaluate whether a position is supported, stretched, or losing structural quality.
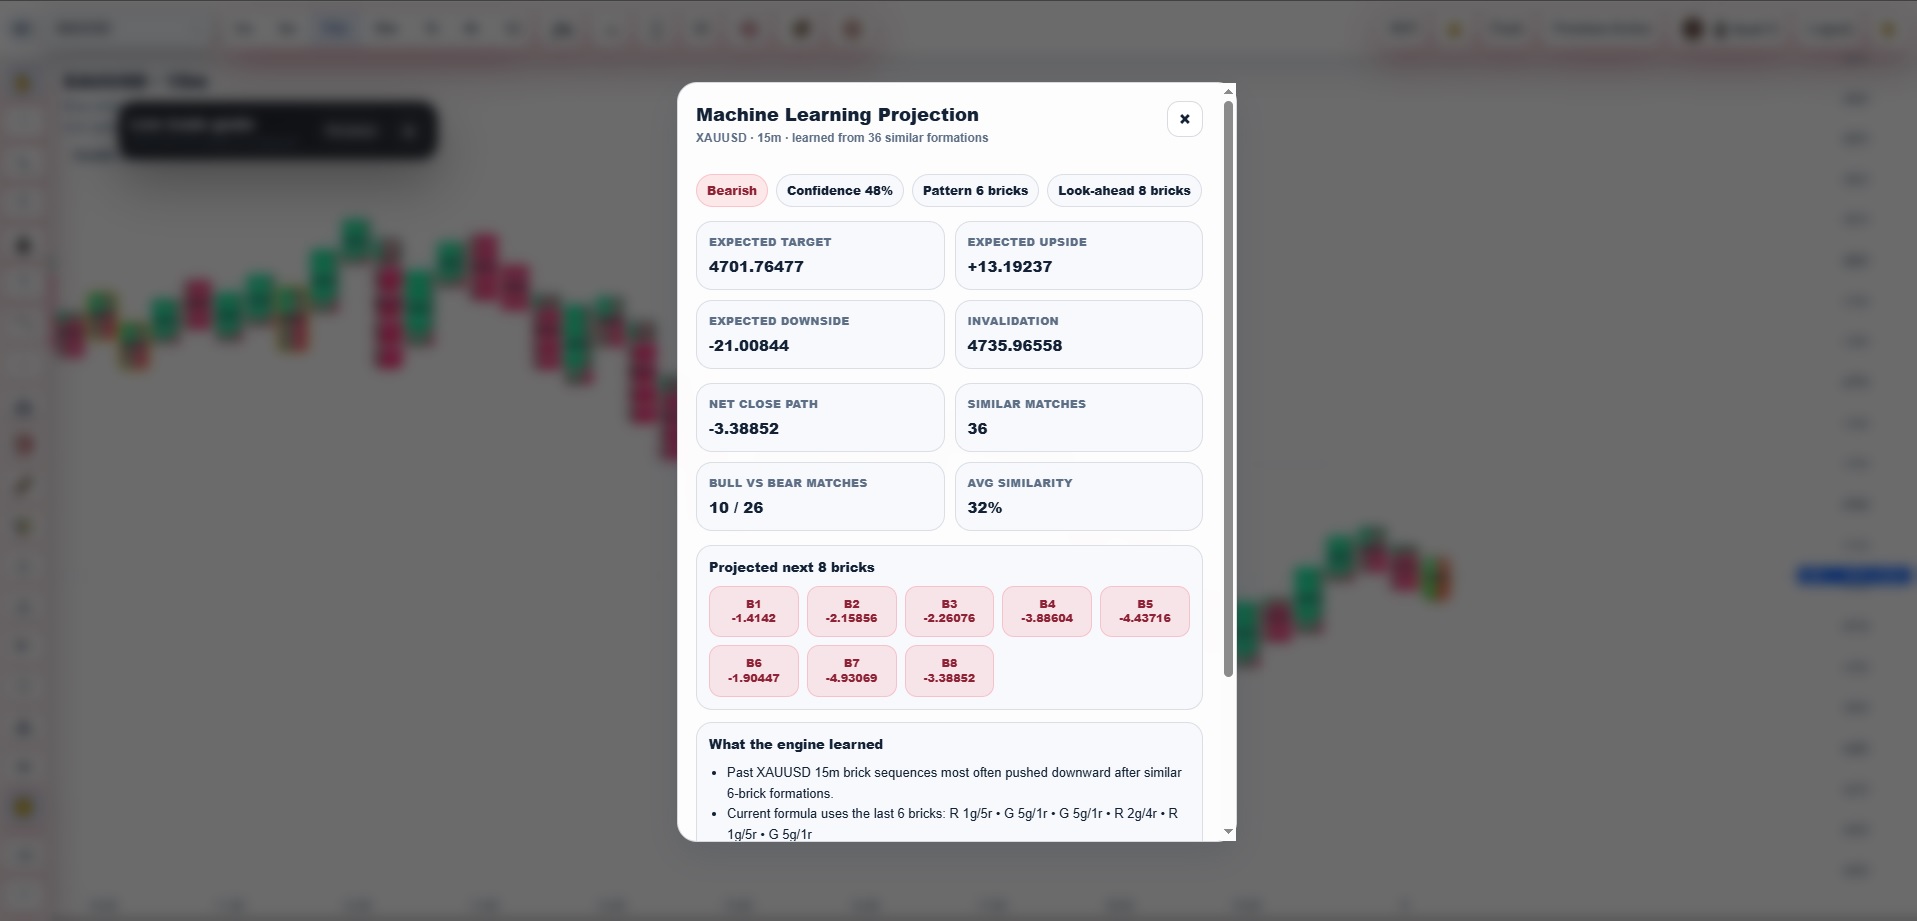
Pattern intelligence
Built-In Machine Learning Projection
Use learned chart pattern comparisons to estimate likely next-path behavior. Rather than promising certainty, the model highlights directional bias, similarity strength, expected path, and invalidation context.
Micro-structure
Bricks Pressure Engine
Read the internal pressure profile of each brick sequence to understand whether buyers or sellers are truly in control beneath the surface. This helps traders judge the quality of momentum instead of relying on color alone.
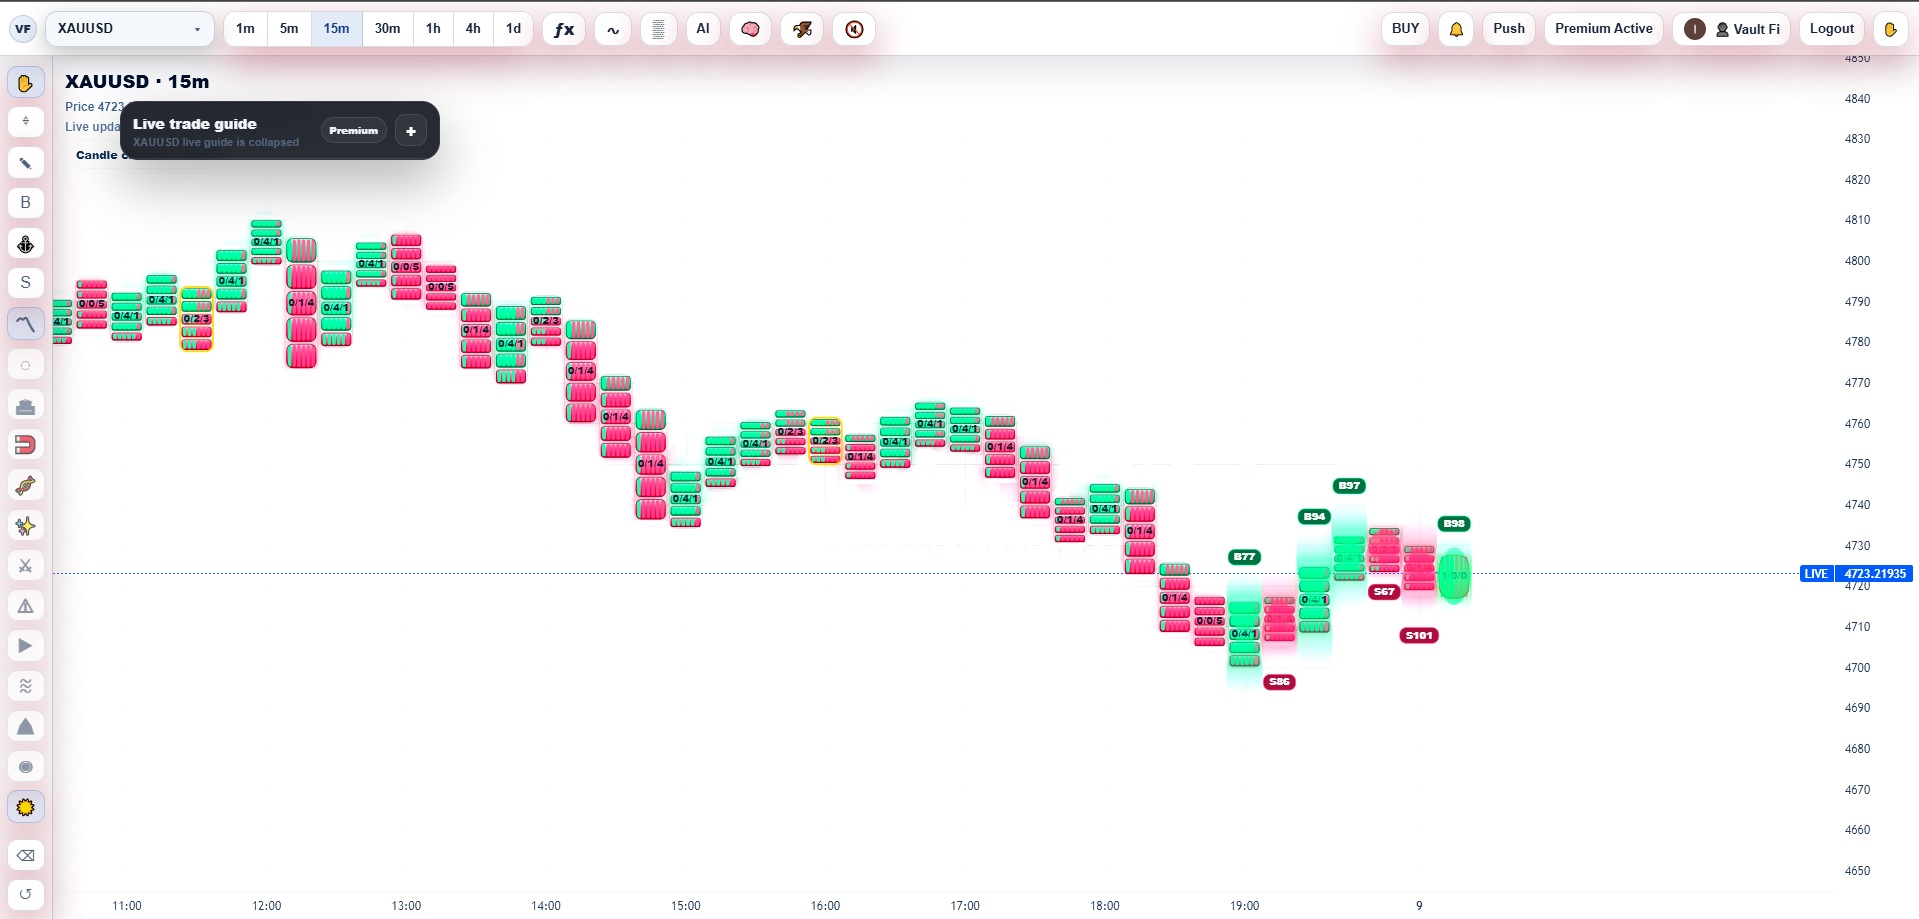
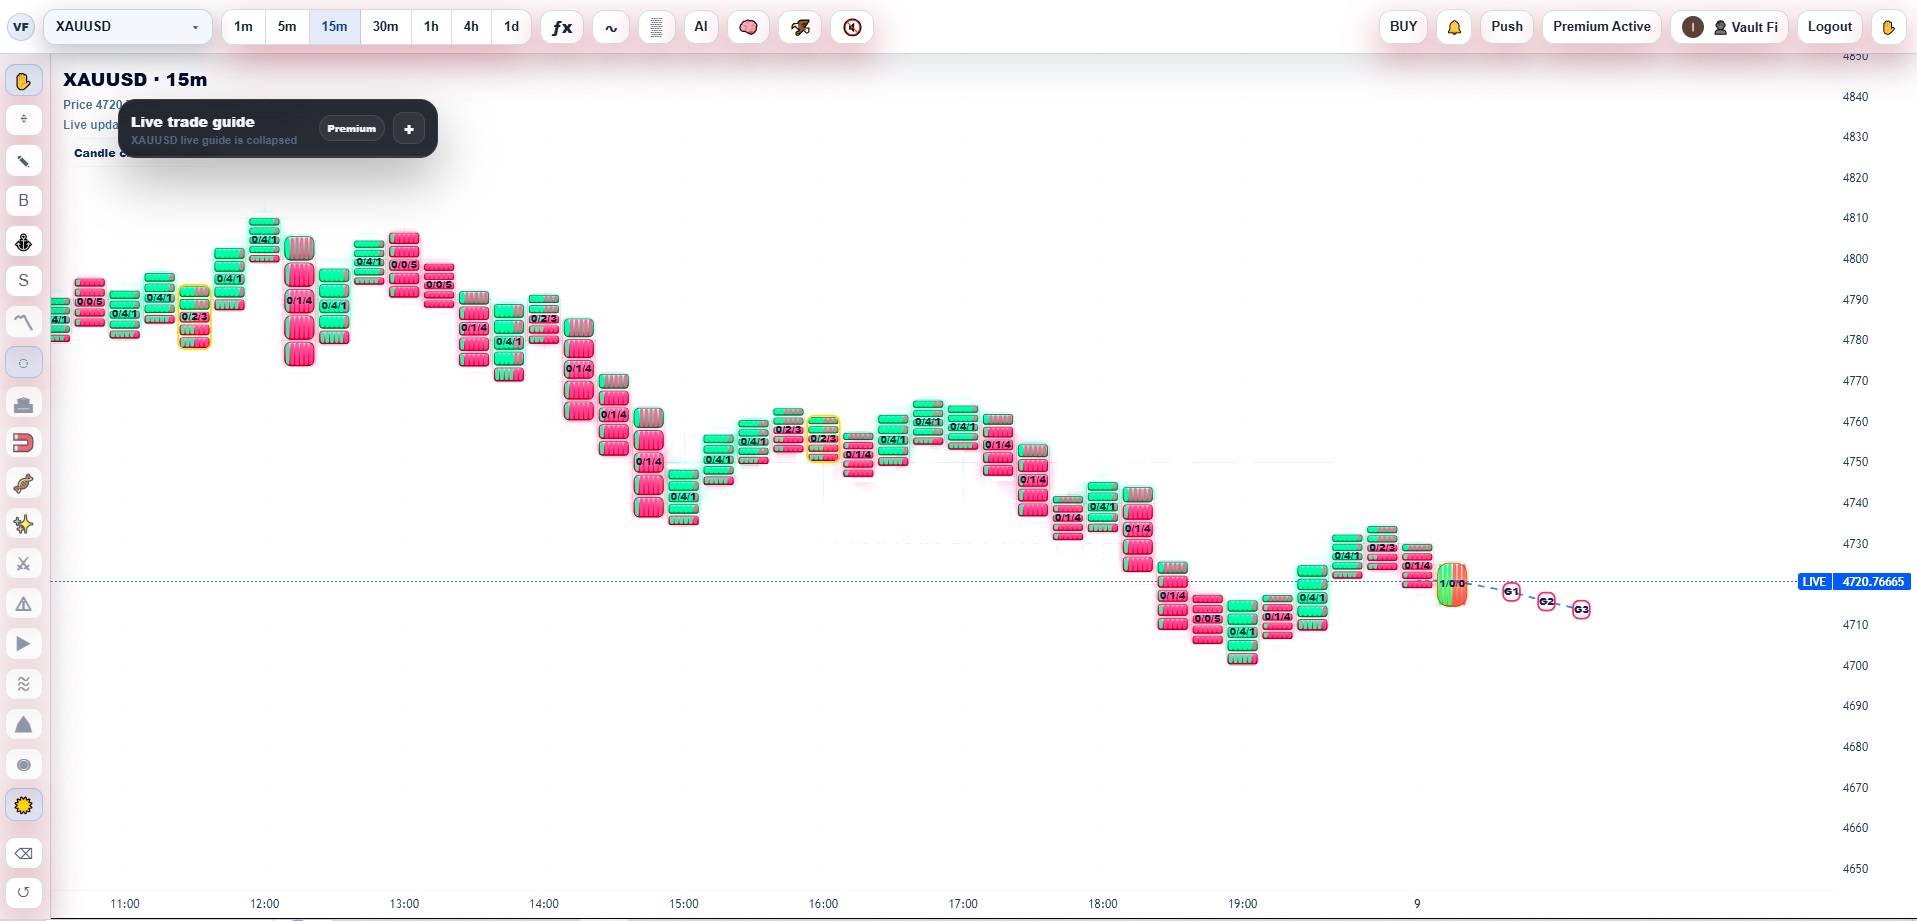
Projected structure
Ghost Bricks
Visualize possible continuation placement ahead of the current live brick so traders can think in scenarios instead of reacting late. This is especially useful when evaluating whether current motion still has room to extend.
Flow tracing
Institutional Footprints
Highlight where pressure has already left a visible mark on the chart. Traders can use this to spot zones where prior activity may influence future reactions, pullbacks, or continuation attempts.
Reaction mapping
Magnetic Reaction Field
See where price is most likely to feel attraction or resistance from the broader structure. This helps traders frame whether price is drifting into a zone of likely reaction rather than floating in neutral space.
Structural signature
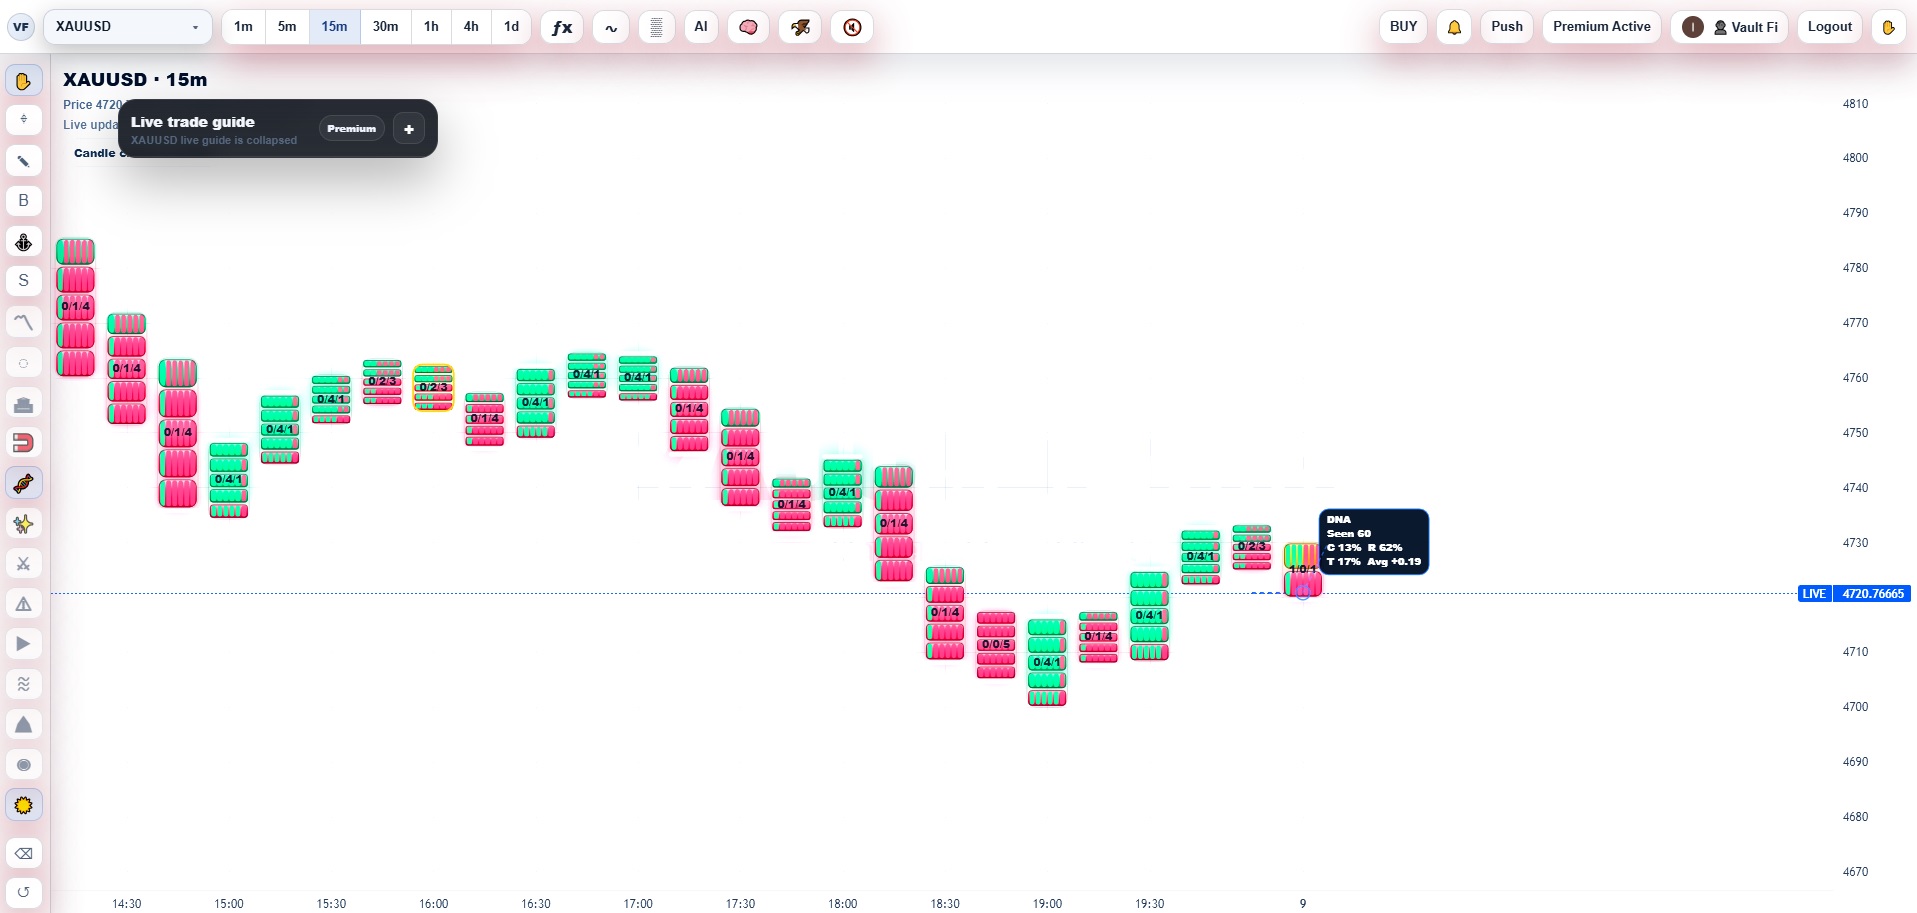
Brick DNA
Inspect the character of the active sequence at a deeper level. Brick DNA helps separate ordinary movement from meaningful behavior by showing whether the structure has the look and feel of stronger continuation or fading momentum.
Momentum rhythm
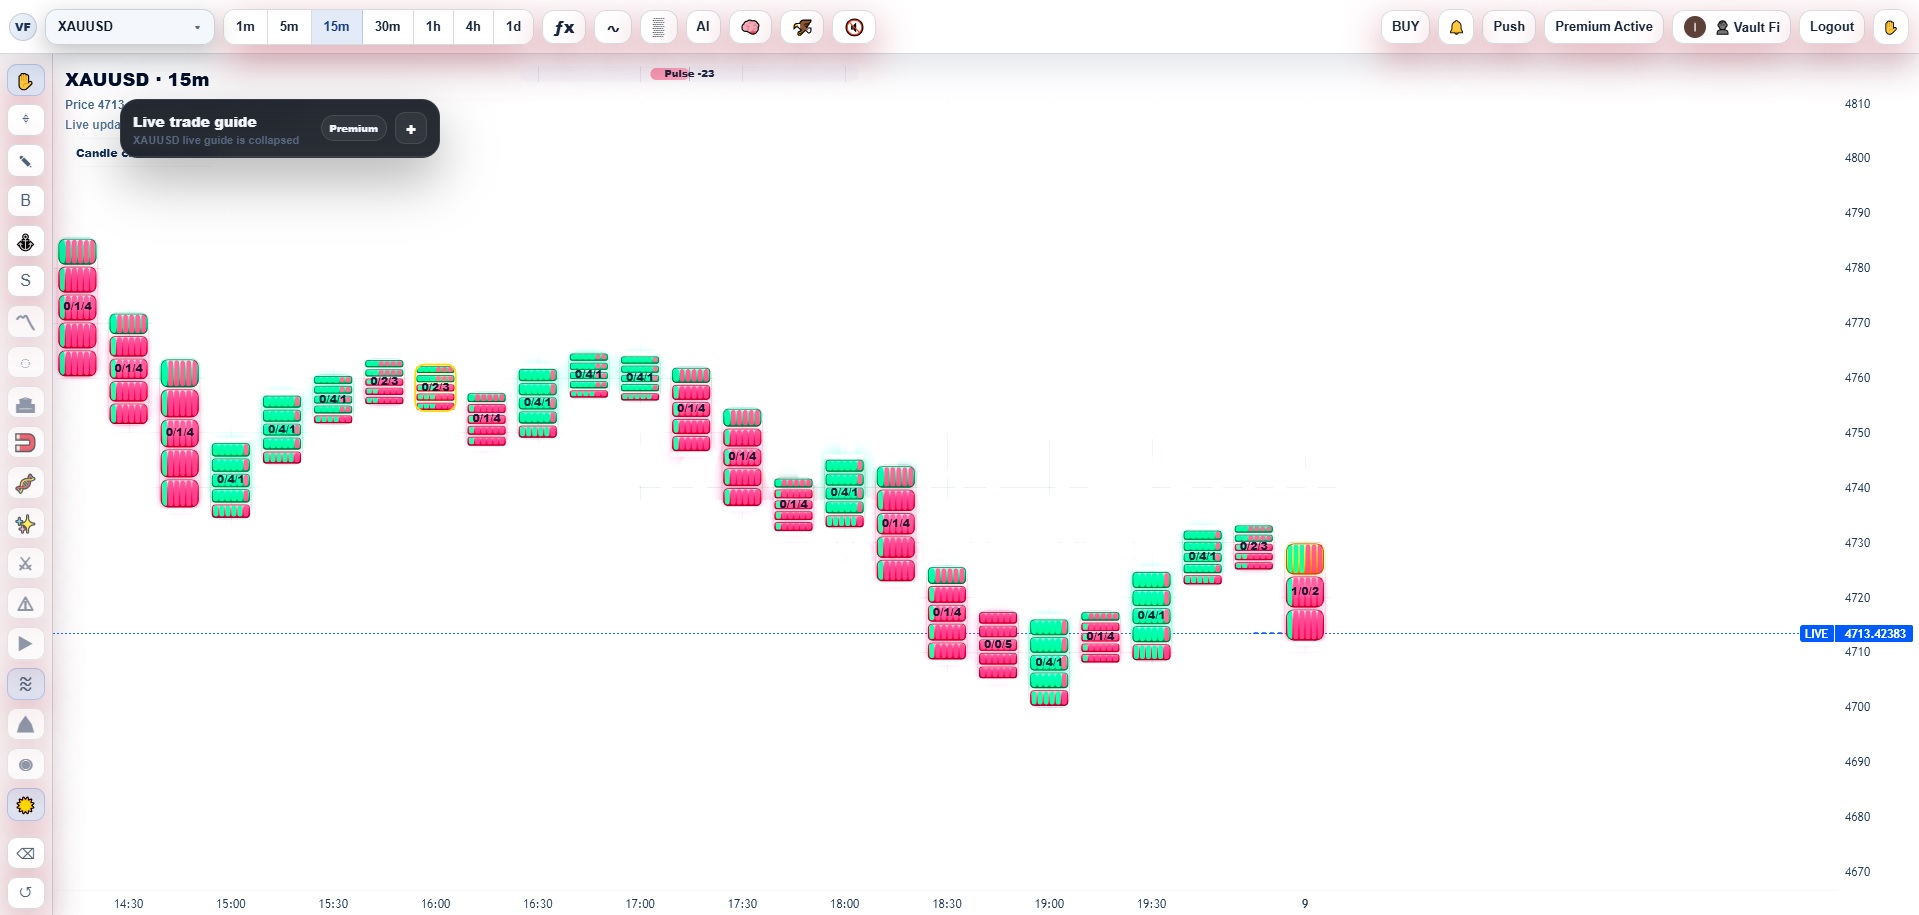
Pulse Ribbon
Track the rhythm of acceleration and slowdown through a cleaner visual layer built for momentum awareness. Traders can use it to judge whether a move is expanding, stabilizing, or losing force.
Confidence overlay
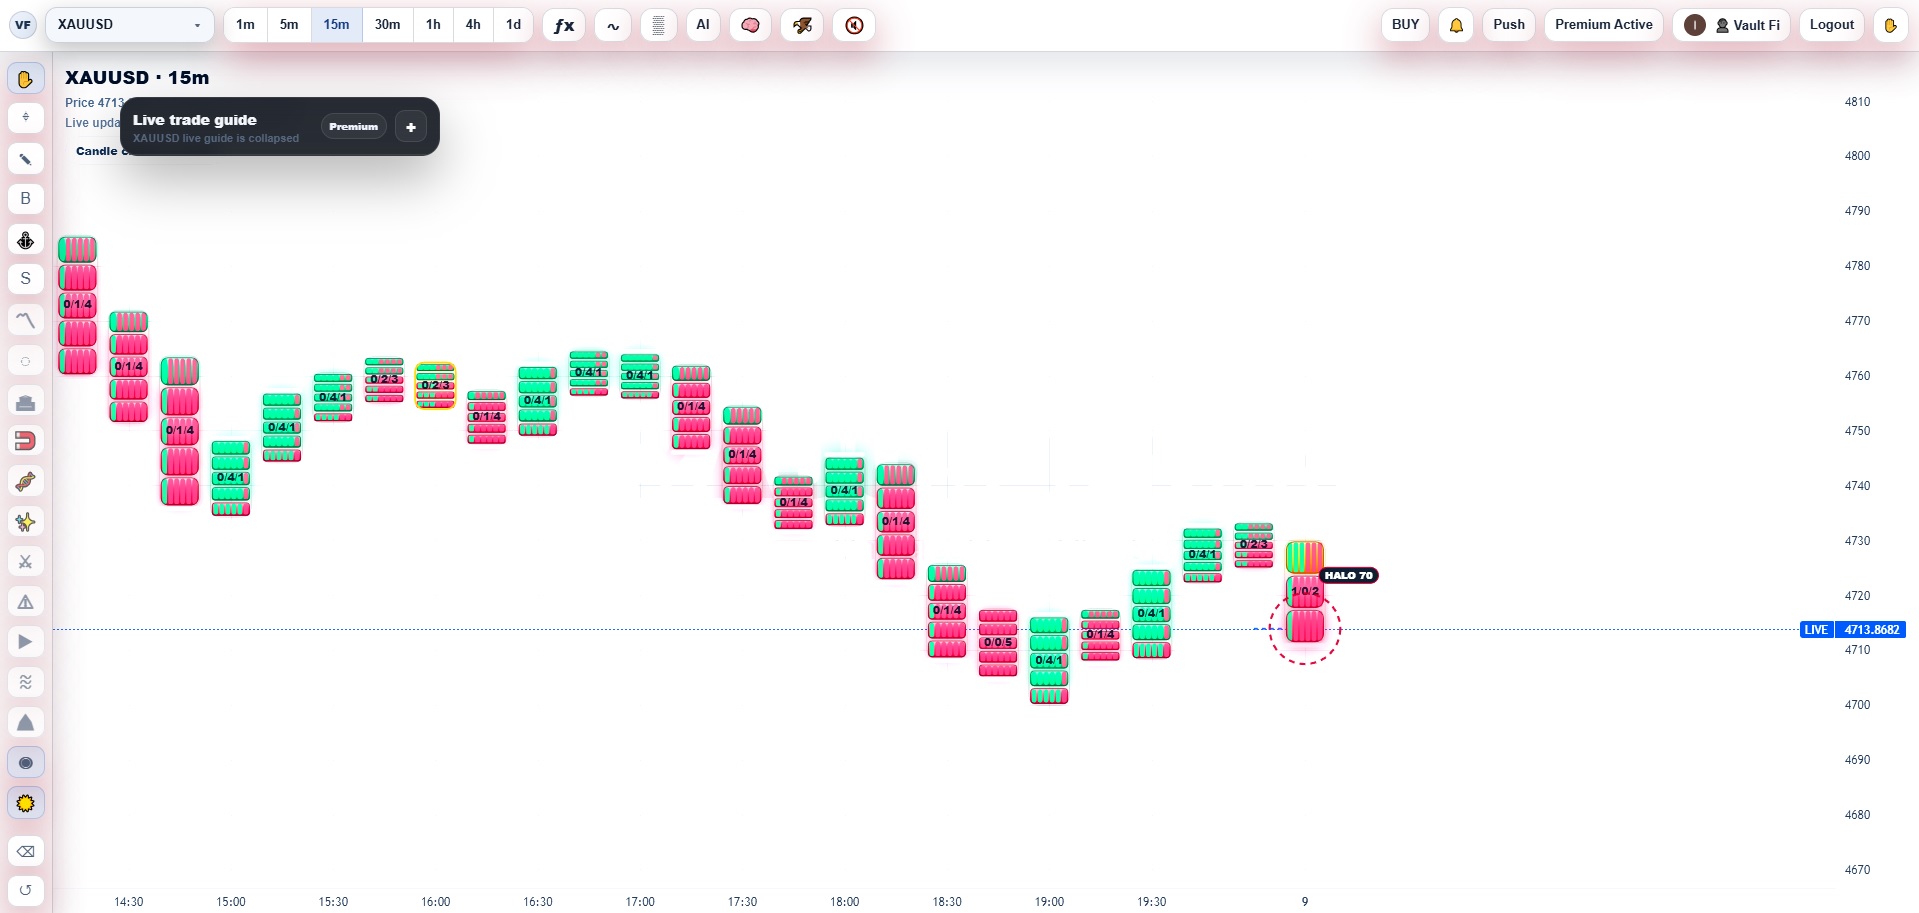
Confidence Halo
The Confidence Halo visually emphasizes when the platform sees a stronger quality read around the active price area. It is designed to help traders quickly identify moments of elevated structural conviction.
Narrative replay
Story Replay
Replay the recent path of the chart as a structured sequence so traders can understand how price arrived at the current location. This is useful for seeing whether the current setup developed through expansion, trap, reclaim, or breakdown behavior.